Author’s Note
The initial post on this systematic investing approach was grounded in a simple idea: I needed enough understanding and conviction in the model to make it public.
If I’m managing my family’s hard-earned capital, then beyond standard risk-management safeguards, public transparency serves as an additional check. Win, lose, or blow up, radical accountability helps strip away bias and self-deception, the mind killer of investors.
After publishing that first post, I hesitated on a Q3 update.
Sharing investment returns felt cringe and I wasn’t sure I wanted to keep doing it. But that discomfort is just ego resistance. It doesn’t undermine the core objective: protecting my family’s capital by continually refining the system while aiming for market-beating performance.
So even though we’re already two months into Q4, I’ve chosen to continue updates for both my own disciplined improvement and anyone following along in their own accounts.
Third Quarter Strategy Returns & Market Debrief
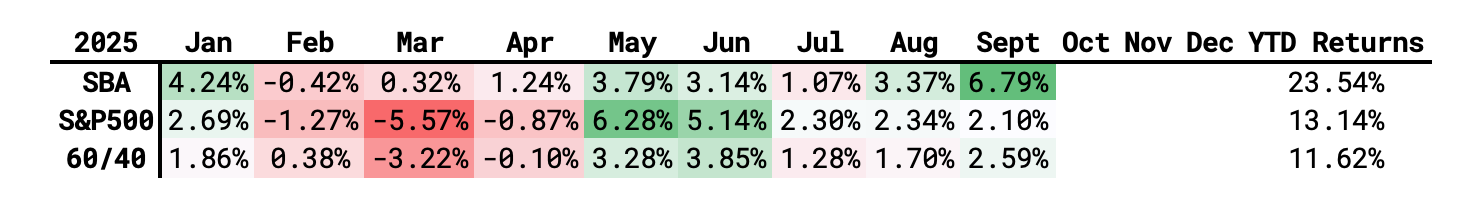
Strong performance continued through Q3. Systematic Behavioral Arbitrage (SBA) delivered more than twice that of a defensive 60/40 portfolio while also outpacing even a fully S&P 500-invested allocation by a similar margin.
Like a three body problem, financial markets in Q3 were governed by the interaction of three fundamental centers of gravity:
The Cost of Capital Reset the Entire Market Regime
When risk free rate falls, the present value of all future cash flows rises. High duration assets, like technology or AI, are most sensitive to this. When the Federal Reserve initiated a dovish pivot in September, it marked the beginning of a rate cutting cycle.
This lowered the discount rates across the curve, producing three immediate effects: Demand for duration increase so large cap tech and AI surged. The cost of capital for small cap stocks finally eased, driving the Russell 2000 Small Cap Index to outperform. Bonds rallied as yields fell, improving asset allocation liquidity.
It’s our stance that this shift in the cost of capital was the dominant tailwind of the quarter. It reset the regime from a tightening and defensive posture to loosening and risk seeking after the tariff induced stock market crash during Q2.
The Real Economy Delivered Enough Cash Flow to Validate Risk Appetite
Asset prices can rise sustainably only when underlying cash flows are stable or improving.
Despite pockets of labor market softening during Q3, consumer spending remained resilient, particularly amongst upper income households. Remember that consumer spending accounts for roughly 70% of GDP in the United States, making it the largest component of the real economy.
Corporate earnings across many sectors outperformed expectations, confirming aggregate demand had not rolled over as previously feared. This provided the real earnings support required for stock valuations to expand and reinforced the credibility of the Fed’s dovish posture.
Thus, real economic output acted as a second tailwind, validating that the rate cut rally was not purely speculative, a rally that has been called one of the most hated equity rallies. However since investing is not a game of analysis but meta analysis, the logic requires an inversion; if everyone is bearish and has moved into a defensive posture, the market can’t go down without an additional catalyst, a catalyst that never materialized.
The AI Investment Flywheel Concentrated Market Leadership
When a new technology paradigm emerges, capital concentrates in firms with the highest expected marginal return on that technology.
During Q3, AI emerged as the dominant marginal return frontier. Markets priced AI infrastructure, chips, and hyperscale compute as having exceptionally high expected productivity, and megacap firms were the primary entities positioned to capitalize given their balance sheet strength.
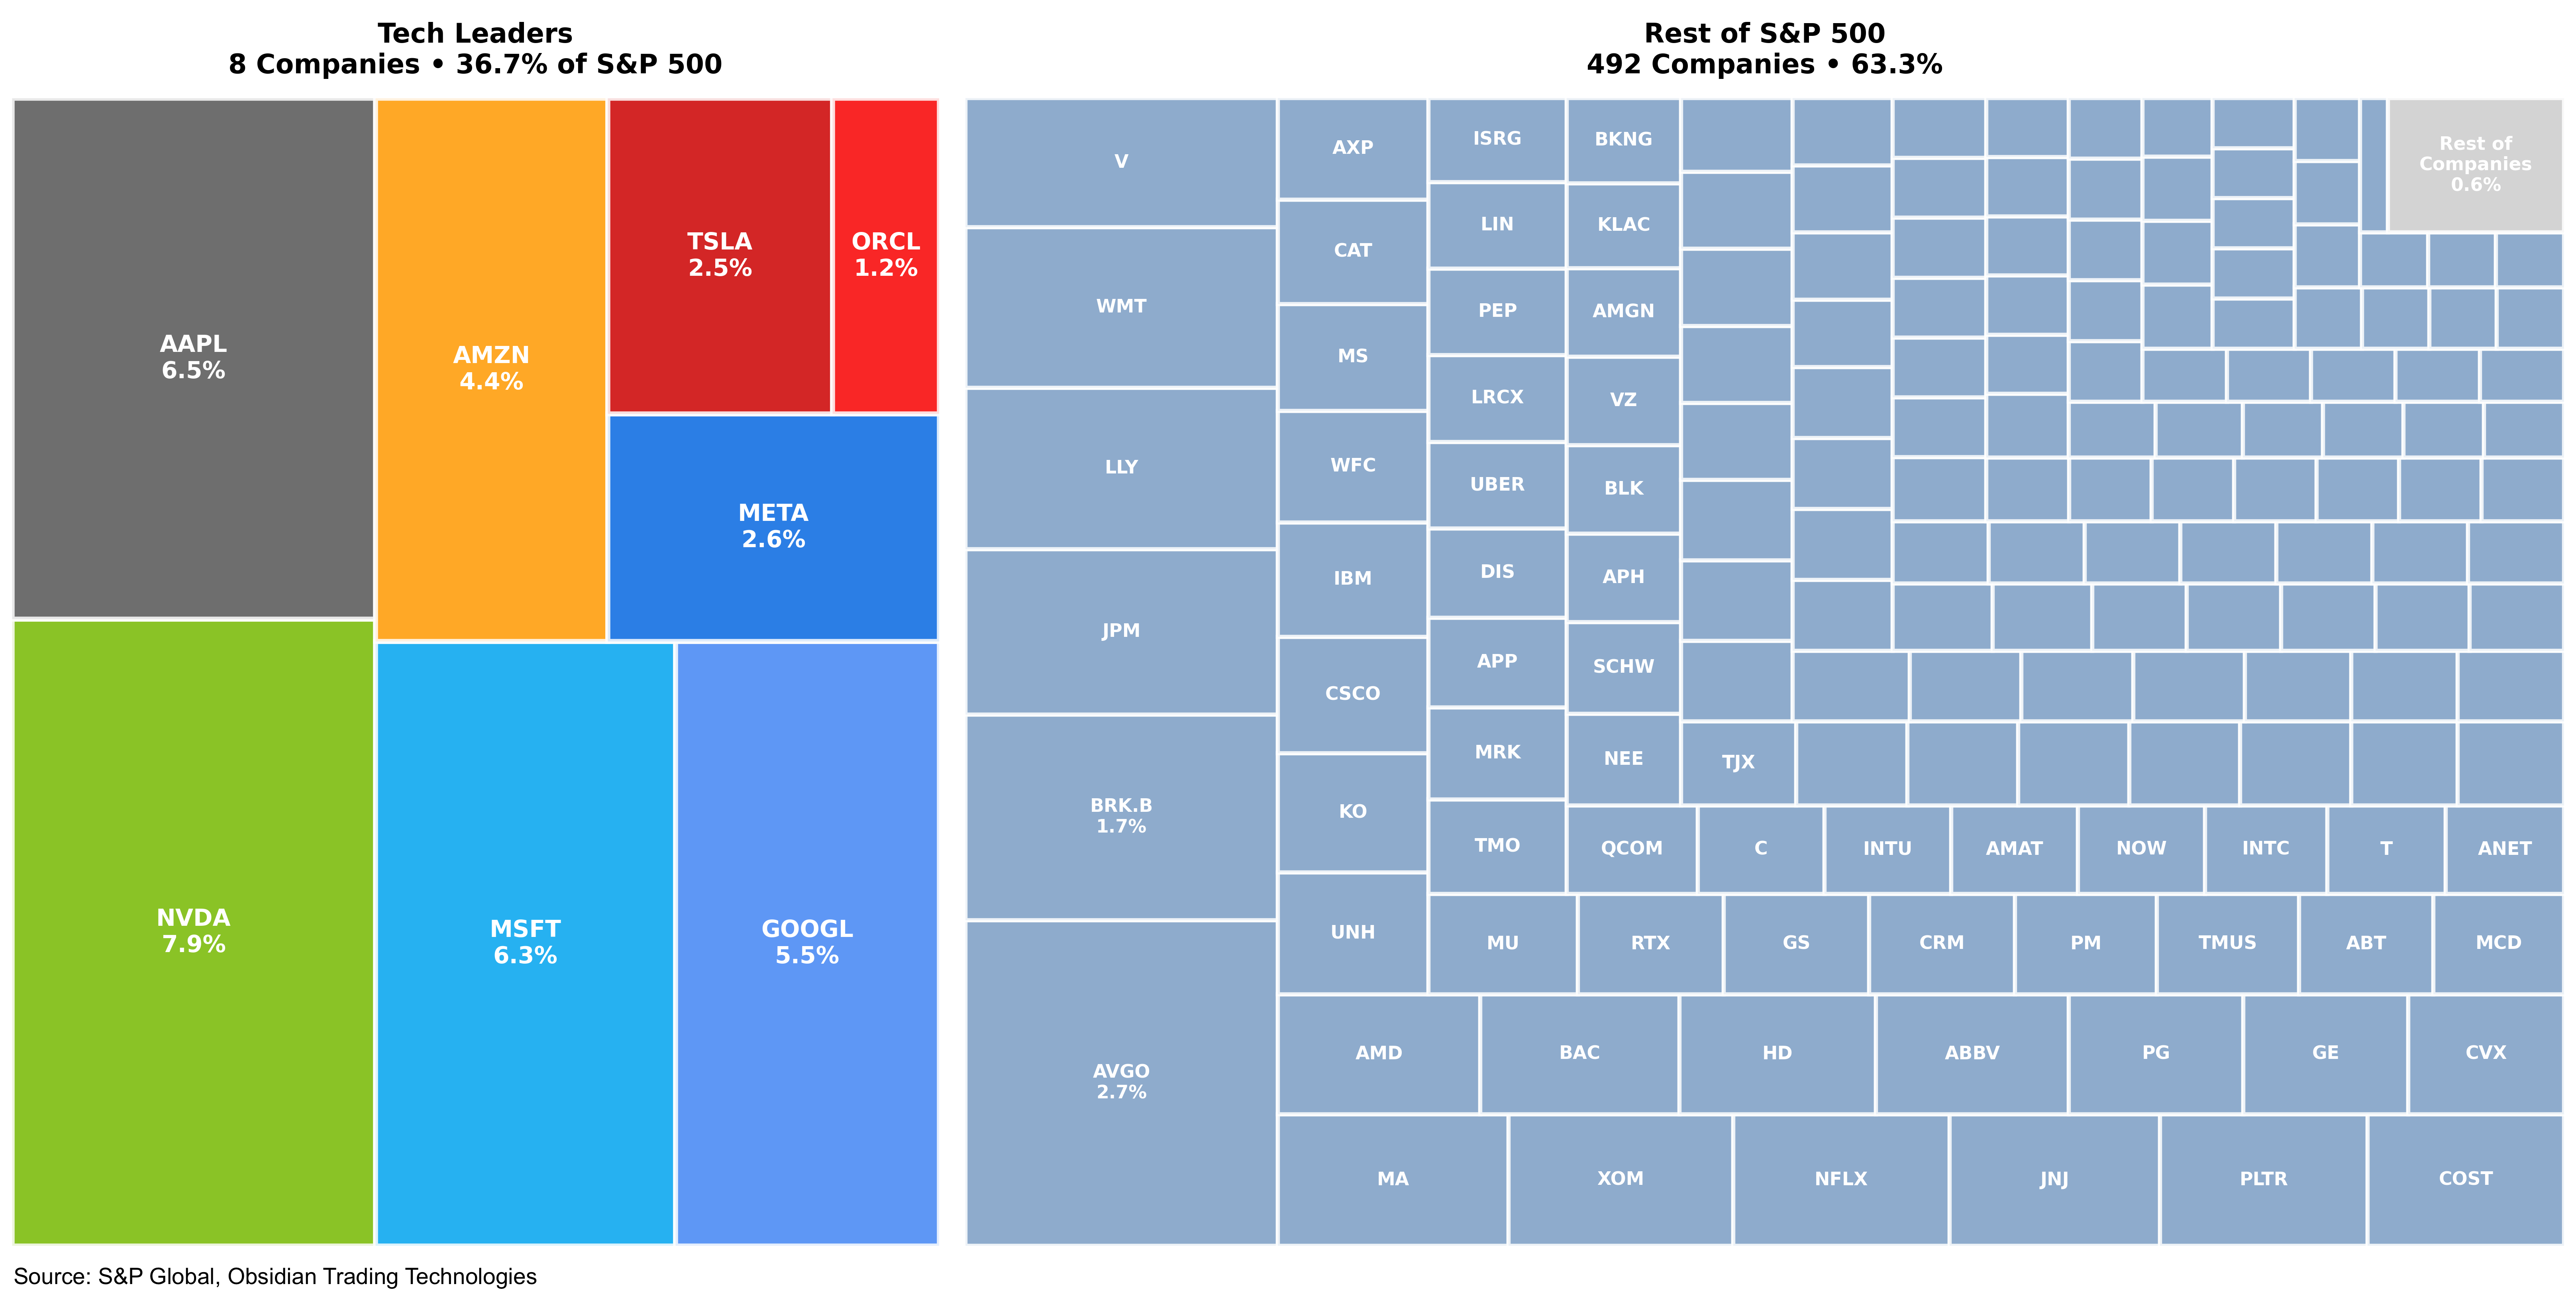
Although it remains unclear where value will ultimately concentrate within this new technological regime, assuming that a disproportionate share of AI-driven cash flows will accrue to a small set of firms with already robust revenue is a defensible hypothesis.
George Soro’s famously remarked “When I see a bubble forming, I rush in to buy, adding fuel to the fire.”
Still, vigilance is strongly warranted. Concerns about an AI-driven bubble are not unfounded. Historically, major technological shifts have frequently coincided with large financial bubbles, and both the magnitude and duration of such episodes can only be recognized in hindsight. Practically, it often feels better to be inside the bubble making money than outside the theater shouting fire.
Whether this level of concentrated outperformance persists is unknowable. Just remember that fortunes are both made and lost inside the bubble.
End of Year Q4 Portfolio Positioning
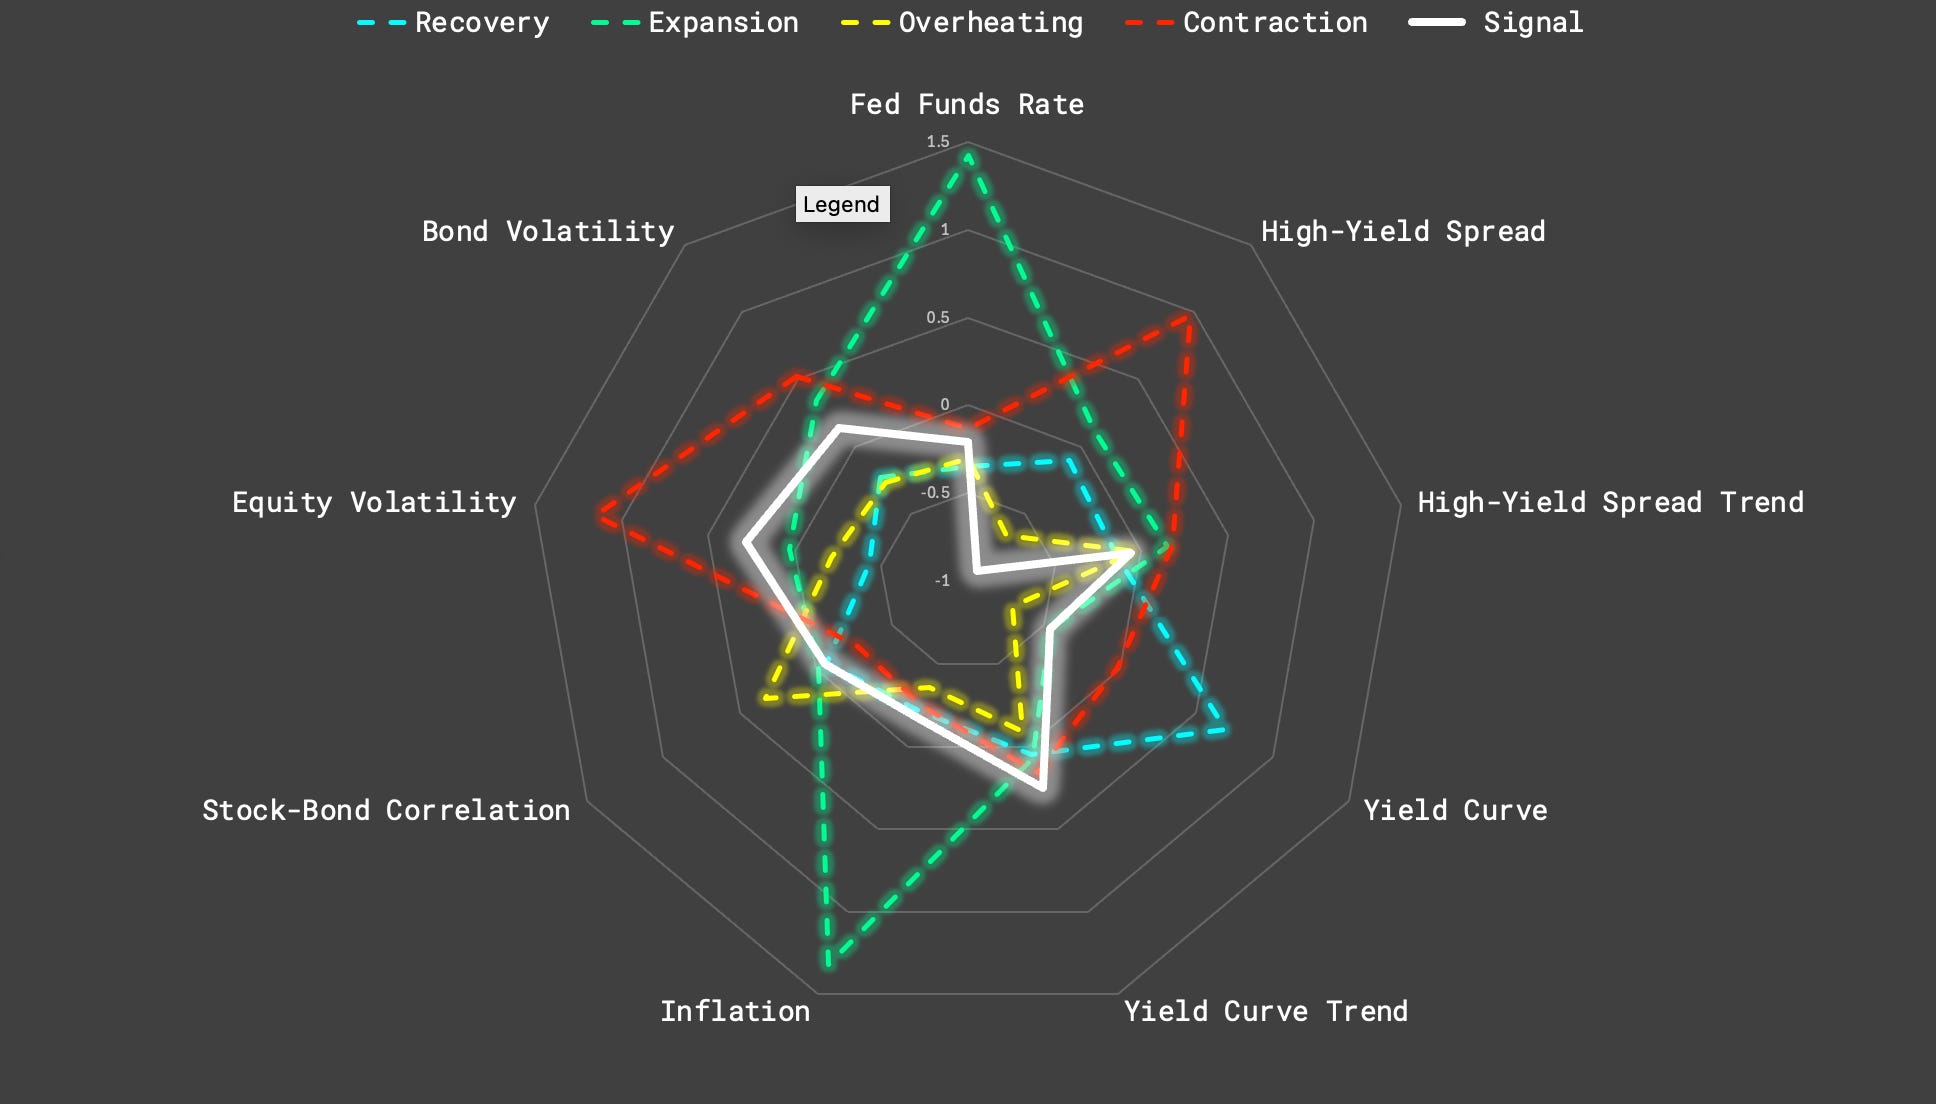
Per the current economic signals, the strategy remains positioned for an overheating economy—characterized by decelerating growth and accelerating inflation.
On the following radar chart, the white solid line is the geometry of our current economic posture.
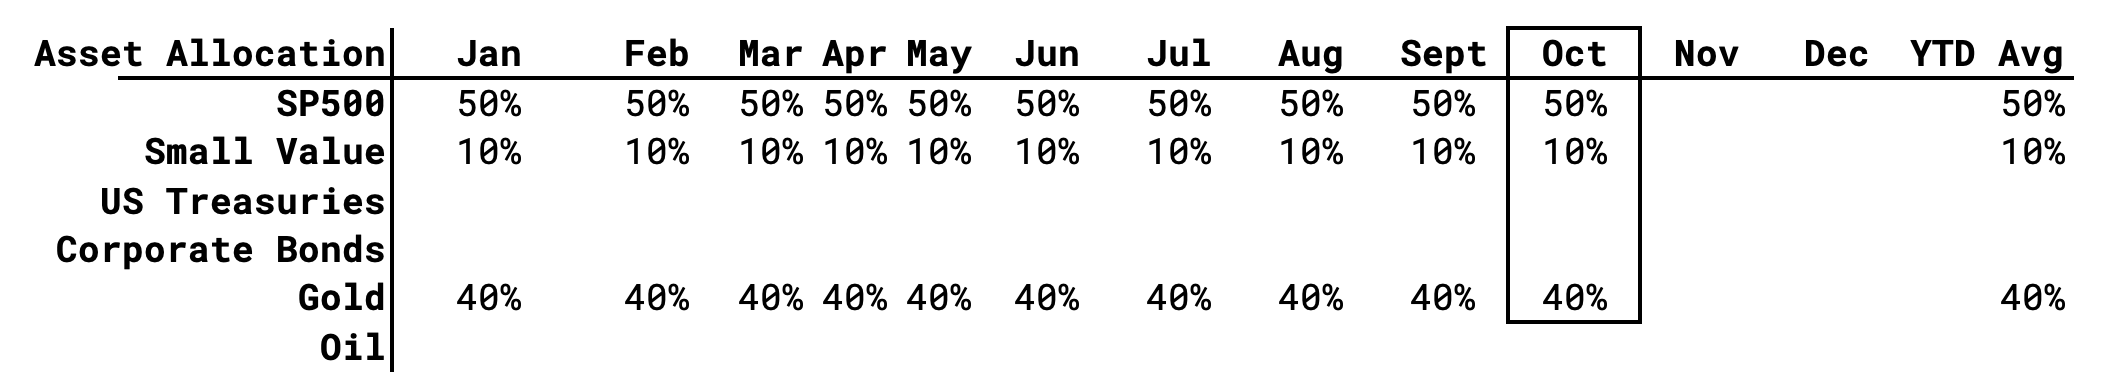
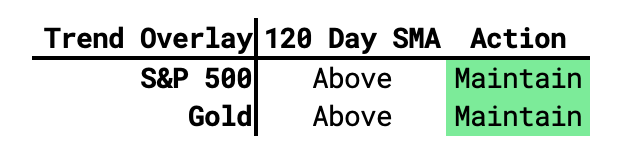
The allocation stays gold-heavy, providing protection against geopolitical or inflation-driven shocks while continuing to benefit from the monetary-debasement narrative amid persistent fiscal deficits.
Our simple, trend-following risk-management overlay, the portfolio seatbelt, continues to signal “party on.” If and/or when the AI bubble bursts, it will protect our capital from any killer long left tail events lurking unseen in the deep.
Expect a Q4 2025 update sometime January 2026.
Until then, stay safe out there. Investing is a professional bloodsport.